When Market momentum is very strong to the upside or downside those types strong unhealthy price action is called Impulsive move, price generally moves in two way impulse and correction.

It’s really simple the representation above but on a real chart, the candlesticks can hide the “easy” understanding and make some confusion to the retail trader.
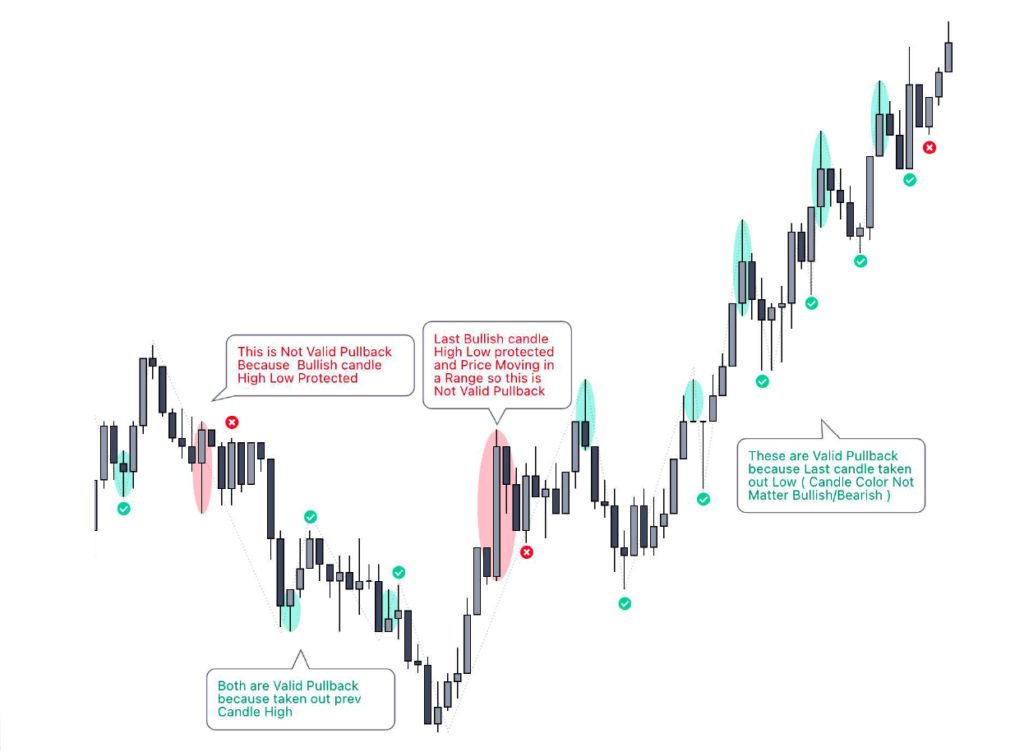
To understand when you can validate a pullback (correction) first of all, you need to see a sweep on liquidity below the candle high (in a bullish impulse) or above the candle low (in a bearish impulse).
More easily, looking the next examples :


Looking on a chart and trying to identify valid pullbacks you can check it from this example :

Believe that understanding the Impulse and Correction (pullbacks) is the first step so important that if you do it wrong, you will fail your trading plan.
FxOB can do it in one click, without getting tricked or confused by all the candles / wicks that price did and probably is doing during your manual analysis.


