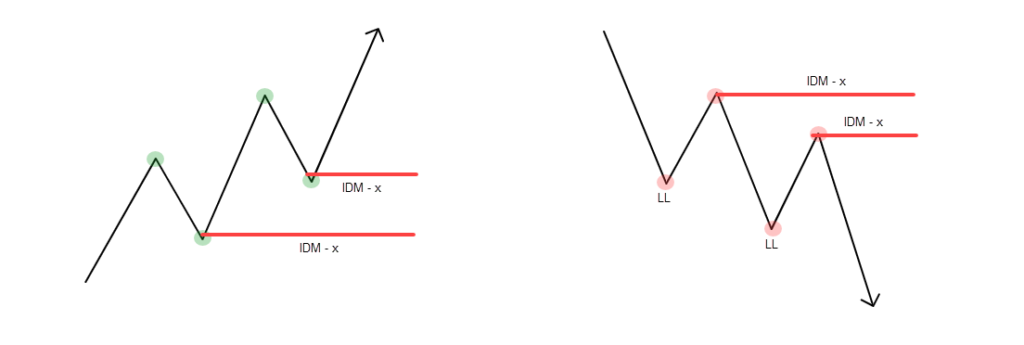
The last price pullback in the market structure is named Inducement (IDM).
IDM is the area and the specific point that prompts (stimulates) traders to buy and sell.
The main criteria for a trend change, as you already know, is a CHoCH. Almost all practicing traders of both technical analysis and Smart Money followers follow the CHoCH as a nice signal for a incoming bias and profitable setups. But as you may have noticed if you’ve ever tried to trade, rather than just googling the ultimate strategy to make money, there’s something that doesn’t tell the truth.
I can understand now, that, all the efforts to add confluences like Moving Averages, MACD and many other indicators, or skip the first choch and wait the BOS to get a confirmed bias, or also to check it on many timeframes to get them aligned… it reveals a failure over failure.
IDENTIFY THE INDUCEMENT (IDM) #
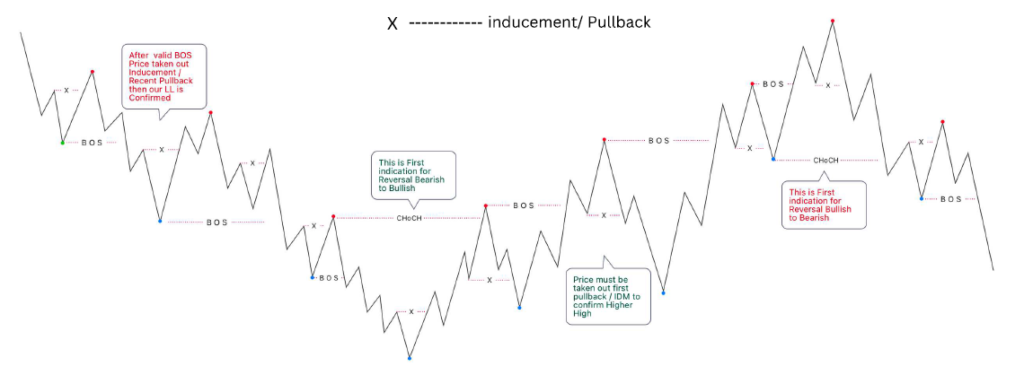
IDM is the extreme point of the last pullback in the structure when the price makes a BOS. Until the price updates the previous high in an ascending trend or the low in a descending one, the IDM remains the previous point.
In the above image, you can see price not reaching the inducements and continue to print higher levels (for bullish bias) and lower levels (for bearish bias). The two “trends” are not creating BOS and the Change of Character is becoming a far possibility.
FxOB shows them and keep them under its eye to evaluate the structure according to the liquidity sweep point of view.
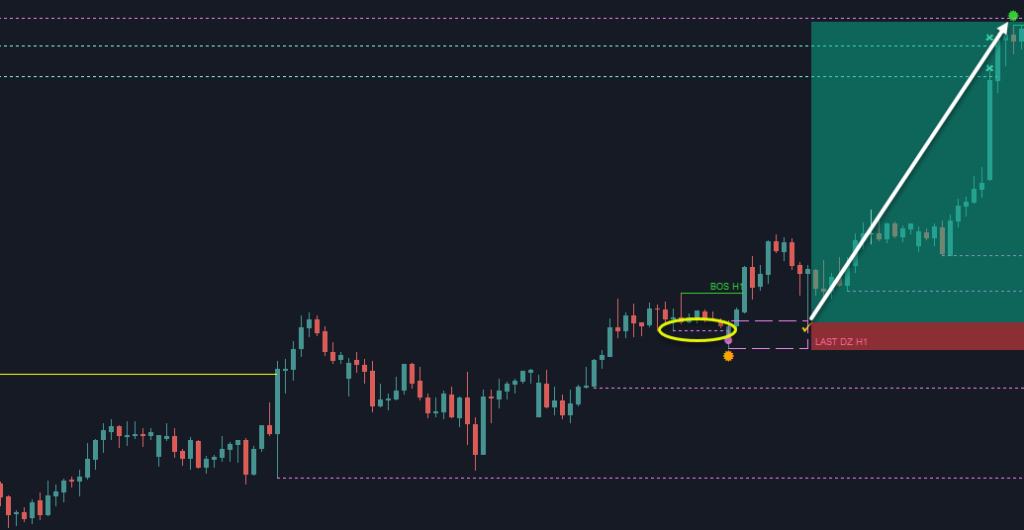
In the above image, FxOB detected an IDM taken and set itself to alert and create the BOS according to price movements. Once did it, it found the POI (in this case a demand zone) where to put the eyes on. And the price respected 100% this area pumping up till a nice 10:1 RR (taking profits to some old supply zones, liquidity area).
As the price moves in one direction, it will always pullback. Regardless of the pullback’s strenght, liquidity is collected; you can anticipate movement,but when it will happen is necessary to get the confirmation by FxOB.