Once you have understood the impulse and pullbacks validation, you can then apply these concepts to get the Market Structure.
First of all i will show you this avoiding Liquidity concepts and you could see a very clear structure, but without a very clear use without some other concepts i will introduce later.
Why? Because the market structure as in the textbook explained, works only on a precise conditions, in all other conditions during the day, the week, the month, the invalidated times are more than the times where the price can confirm your plan.
To determine the state of the market, we need to identify the sequence of highs and lows of the structure :
- HH = Higher High
- HL = Higher Low
- LL = Lower Low
- LH = Lower High
- EH = Equal Highs
- EL = Equal Lows
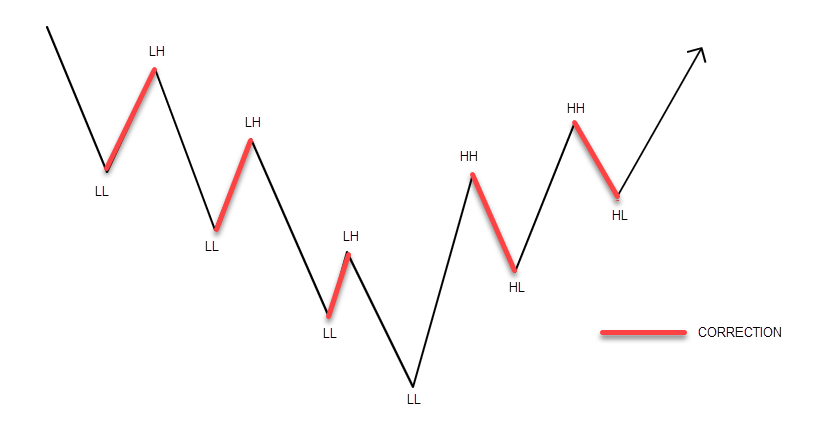
Based on the sequence of peaks and valleys, the market can be in three states :
- Bullish Market structurte : a sequence of higher lows (HL) and higher highs (HH)
- Bearish Market structure : a sequence of lower highs (LH) and lower lows (LL)
- Sideways : consists in a structure (with some EH and EL) internal to the main structure (bullish or bearish)
Based on the clear positioning of highs and lows, we determine the market’s direction and corresponding trading plans. Depending on the current trend, we will define our POI (points of interest) and wait for a trading setup.
BREAK OF STRUCTURE (BOS) #
This denotes the continuation of a trend when the price updates the previous higher high (HH) in a bullish trend or a lower low (LL) in a bearish trend.
This is schematically represented as follows :

Everyone, look at the diagram above. The left depicts a bullish structure, the right a bearish one. When the price updates the previous high in an ascending trend or the low in a descending trend, the breakout point is called BOS.
The left and right sides of the diagram represent BOS in ascending and descending structures respectively. When breaking the previous high or low, the trend is considered to be continuing. Nothing new here, it’s all consistent with classic technical analysis, just trendy notation.
CHANGE OF CHARACTER (CHoCH) #
This indicated a trend reversal when the price drops below the last low in an ascending structure (HL) or rises above the last high in a descending structure (LH).
It looks like this :
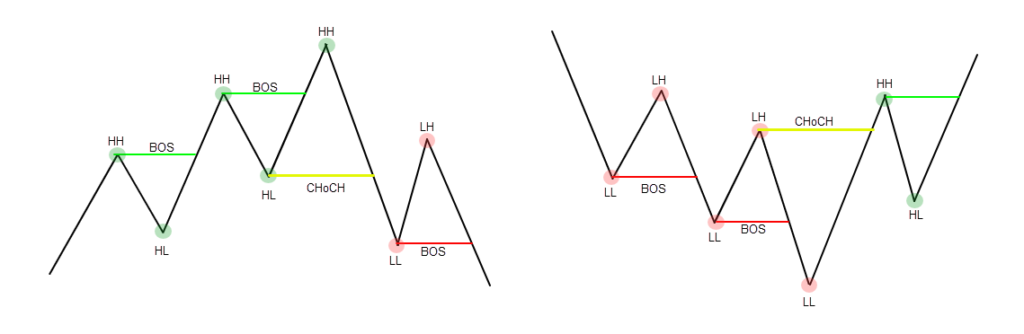
The image on the left : when the price falls below the last low in an ascending structure, the structure breaks and the trend intends to reverse its direction.
The image on the right : when the price rises above the last high in a descending structure, the structure breaks, and the trend intends to reverse its direction.

This is a classic concept of market charter change, utilized not only in traditional technical analysis but also in the Smart Money Concepts.
But that’s not all; it gets a bit more interesting…